
At SoluProject, we offer tailored Excel Data Analysis and Interactive Dashboard services to help you gain valuable insights from your data and make informed business decisions. Our services are designed to streamline your data processes, enhance your reporting capabilities, and support your strategic goals. Turn raw data into actionable insights using Excel’s powerful data analysis and visualization tools.
Feature Description of the Basic Service:
✅ Small & Medium Excel Data Analysis: Handle analysis for small to medium datasets to extract essential insights.
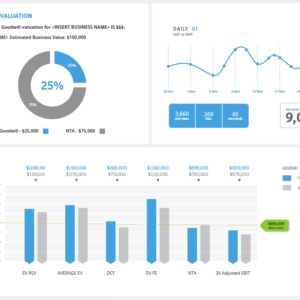
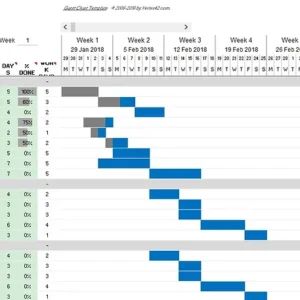
✅ Standard Dashboards with Real-Time: Build simple dashboards that update with real-time data.
❌ Customized & Infographic Visualizations: This feature is not included in the Basic Service.
✅ PivotTables: Utilize basic PivotTables to summarize and analyze data effectively.
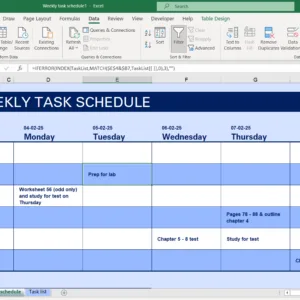
✅ Standard Filters: Implement basic filtering options to streamline data exploration.
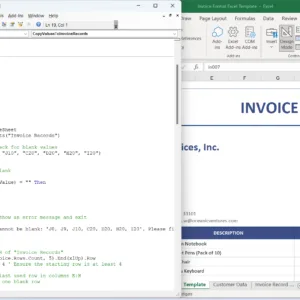
❌ Excel Data Cleaning & Data Repair: This feature is not included in the Basic Service.
❌ Data Integration: Database, CSV, Cloud: This feature is not included in the Basic Service.
❌ Scalable Solutions for Large Datasets: This feature is not included in the Basic Service.
✅ Standard Formulas for Insights: Use essential formulas for straightforward data processing and insights.
✅ Conditional Format to Trends: Apply basic formatting rules to highlight data trends.
❌ Forecasting, Scenario Analysis & What-If: This feature is not included in the Basic Service.
❌ Sparkline Charts for Quick Trend Analysis: This feature is not included in the Basic Service.
❌ File Protection & Password Recovery: This feature is not included in the Basic Service.
❌ User Guides and Video Instruction: This feature is not included in the Basic Service.
Supportive Tools, Features and Functions:
- Data Cleaning: Use tools like Text-to-Columns, Remove Duplicates, and Power Query for efficient data preparation.
- Statistical Analysis: Perform advanced calculations using built-in functions such as AVERAGE, MEDIAN, STDEV, VAR, and CORREL.
- Dynamic Dashboards:
- Create interactive dashboards with slicers, timelines, pivot tables, and pivot charts.
- Link dashboards to real-time data sources for live updates.
- Advanced Visualization: Build dynamic charts like scatter plots, histograms, waterfall charts, and combo charts.
- Scenario Analysis: Conduct what-if analysis, goal seek, and sensitivity analysis using data tables and scenarios.
- Reporting Automation: Generate automated, structured, and visually appealing reports.
Excel Built-in Tools:
- Power Query
- Power Pivot
- Pivot Tables and Pivot Charts
- Slicers and Timelines
- Conditional Formatting for insights visualization
- And other tools as needed
Formulas and Functions:
- Logical: IF, AND, OR, IFS
- Lookup: XLOOKUP, INDEX-MATCH, OFFSET
- Array Formulas: FILTER, UNIQUE, SORT, SEQUENCE
- Statistical: RANK, PERCENTILE, LARGE, SMALL
- And other Functions as needed


Mohammad Shariful Islam –
It’s a great service.