
Feature Description of the Premium Service:
✅ Large & Complex Data Analysis: Perform in-depth analysis of extensive and intricate datasets to uncover actionable insights.
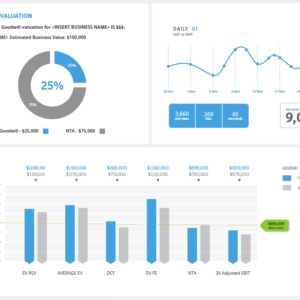
✅ Dynamic Dashboards with Real-Time: Create dashboards that update automatically with real-time data for instant decision-making.
✅ Customized & Infographic Visualizations: Design tailored visual representations with an emphasis on clarity and aesthetics for impactful storytelling.
✅ PivotTables, Power Query, Power Pivot: Use advanced Excel tools to efficiently organize, analyze, and model large data volumes.
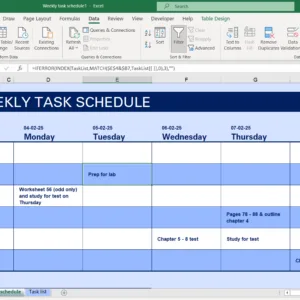
✅ Interactive Filters, Slicers, and Drop-Down: Add user-friendly interactive elements to enhance data exploration and customization.
✅ Excel Data Cleaning & Data Repair: Ensure accuracy by removing inconsistencies and repairing errors in datasets.
✅ Data Integration: Databases, CSVs, Clouds: Seamlessly connect Excel with external data sources, including databases and cloud platforms.
✅ Scalable Solutions for Large Datasets: Design systems capable of handling growing data needs without compromising performance.
✅ Complex Formulas for Advanced Insights: Implement advanced calculations to derive deeper insights from your data.
✅ Conditional Format to Trends: Highlight data trends with customizable color-coded rules for quick identification.
✅ Forecasting, Scenario Analysis & What-If: Perform predictive analyses and explore various scenarios to make informed decisions.
✅ Sparkline Charts for Quick Trend Analysis: Use miniature charts embedded in cells to visualize trends at a glance.
✅ File Protection & Password Recovery: Safeguard sensitive data with advanced security measures and recover lost passwords when needed.
✅ User Guides and Video Instruction: Provide comprehensive user manuals and video tutorials for easy adoption and usability.
Supportive Tools, Features and Functions:
- Data Cleaning: Use tools like Text-to-Columns, Remove Duplicates, and Power Query for efficient data preparation.
- Statistical Analysis: Perform advanced calculations using built-in functions such as AVERAGE, MEDIAN, STDEV, VAR, and CORREL.
- Dynamic Dashboards:
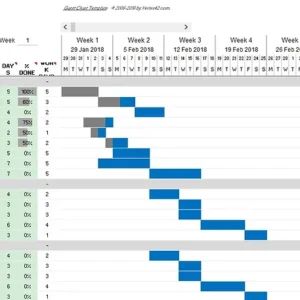
- Create interactive dashboards with slicers, timelines, pivot tables, and pivot charts.
- Link dashboards to real-time data sources for live updates.
- Advanced Visualization: Build dynamic charts like scatter plots, histograms, waterfall charts, and combo charts.
- Scenario Analysis: Conduct what-if analysis, goal seek, and sensitivity analysis using data tables and scenarios.
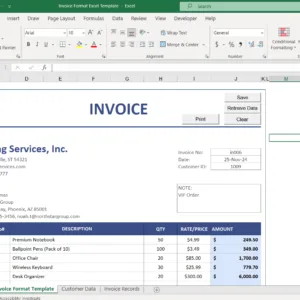
- Reporting Automation: Generate automated, structured, and visually appealing reports.
Excel Built-in Tools:
- Power Query
- Power Pivot
- Pivot Tables and Pivot Charts
- Slicers and Timelines
- Conditional Formatting for insights visualization
- And other tools as needed
Formulas and Functions:
- Logical: IF, AND, OR, IFS
- Lookup: XLOOKUP, INDEX-MATCH, OFFSET
- Array Formulas: FILTER, UNIQUE, SORT, SEQUENCE
- Statistical: RANK, PERCENTILE, LARGE, SMALL
- And other Functions as needed


Reviews
There are no reviews yet.